Chart USDJPY setelah close Candle daily tanggal 25 April
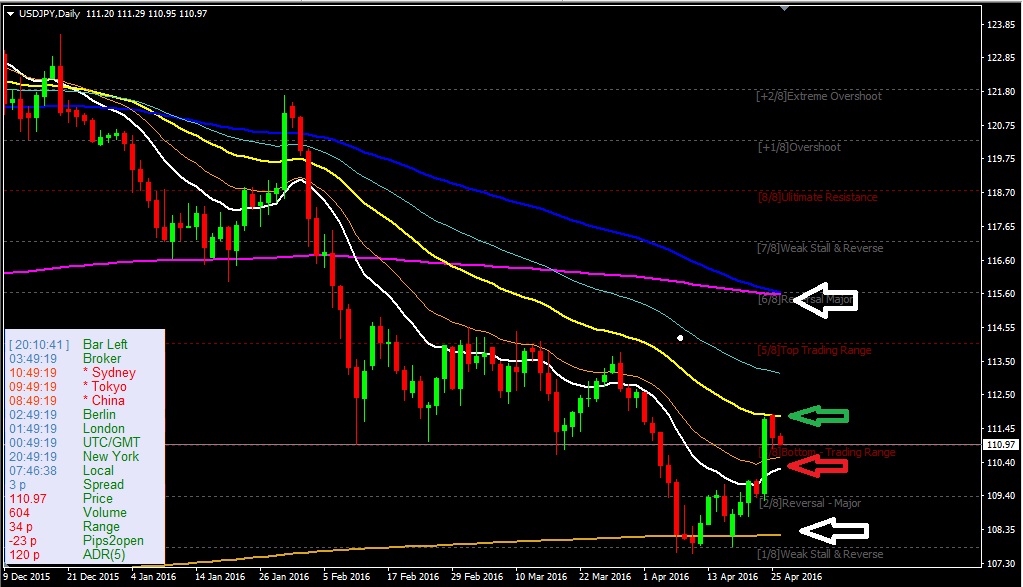
Arah candle Daily berdasarkan garis MA 8 cenderung turun, Range terbatas MA Kuning sebagai resistent dan MA Putih sebagai Support nya.
Untuk Intra Day bisa di lihat TF H1 nya


Tagged with: Analisa USDJPY
07:54:00
